
This graph examines not only the volume of plastic that is exported from the United States alone each year, but also highlights the primary importers of plastic waste. What’s interesting to note is that in all three years, Canada consistently remains one of the biggest importers of the US’s plastic waste, likely due to the proximity of the two countries. Other notable trends that are consistent throughout all three years are that the US exports large volumes of plastic waste to East and Southeast Asia and that although there are exports to Europe and South America, these are not as significant.
Breaking down the map further shows other interesting patterns. The most eye-catching trend would be in 2017, in which there was a sudden uptick in exporting plastic waste to China as a result. This rise is notable due to both the volume of plastic waste exported (no other country matches the amount in any of the three years) and due to the abruptness in the trend -- it was only something that occurred in 2017. After 2017, the Chinese government implemented the National Sword Policy, which limited the type of waste products that could be imported (Javorsky 2019); this is then reflected in the 2018 version of our map. Other notable elements include the increase of plastic waste export in Malaysia; while Malaysia was merely a minor importer of US plastic waste in 2016, it rapidly grew to become one of the larger importers in 2017 and 2018.
Overall, all three years show that the exportation of the United States’s plastic waste is very global in nature. Though the individual countries and the volume may change from year to year, what this graph highlights is that the United States acts as a huge distributor of plastic. Not only does this affect how waste travels on a surface level, but there are also many underlying factors (such as economic, environmental, etc) that are affected as a result.
Although our datasets have shown the quantifiable side of plastic pollution and its effects, it doesn’t necessarily portray the full picture of how devastating waste pollution can be.
The following are some stories that show the effects of plastic waste and plastic waste mismanagement from a more intimate perspective.
Click on a story to read more.
This article dives into the amount of plastic that ends up in the ocean as a consequence of plastic being used in general and highlights a route in which oceanic patterns lead to the accumulation of plastic waste in certain areas.

Water inadequacy is one of the main consequences and issues that we covered in our earlier data; this article captures some of these effects on communities around the world through imagery.
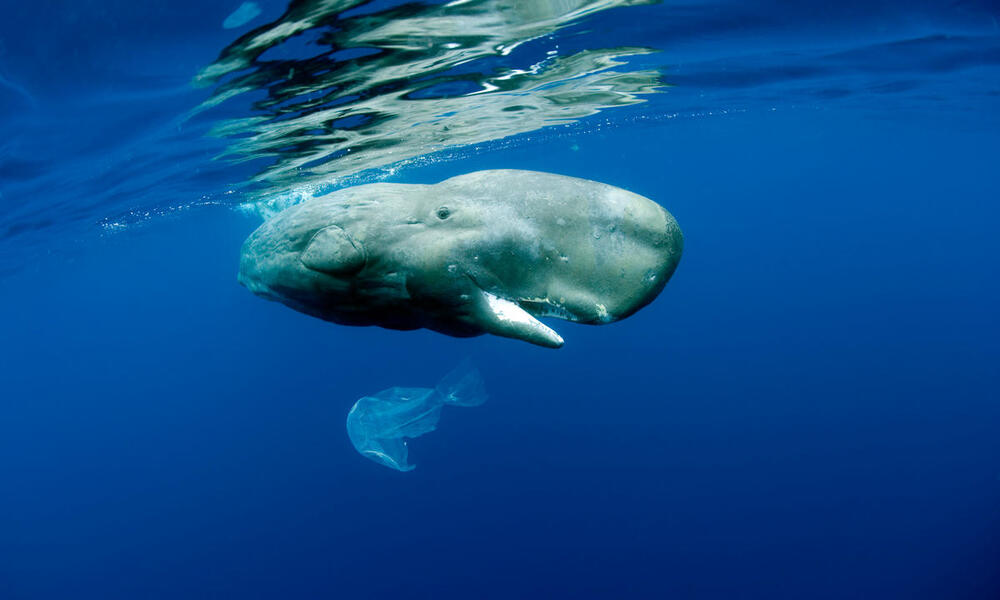
This article dives into how plastics affect the oceanic environment, and how plastic waste in turn affects the ecosystems beyond human civilization. In other words, it provides insight into the effects plastics have on non-humans.
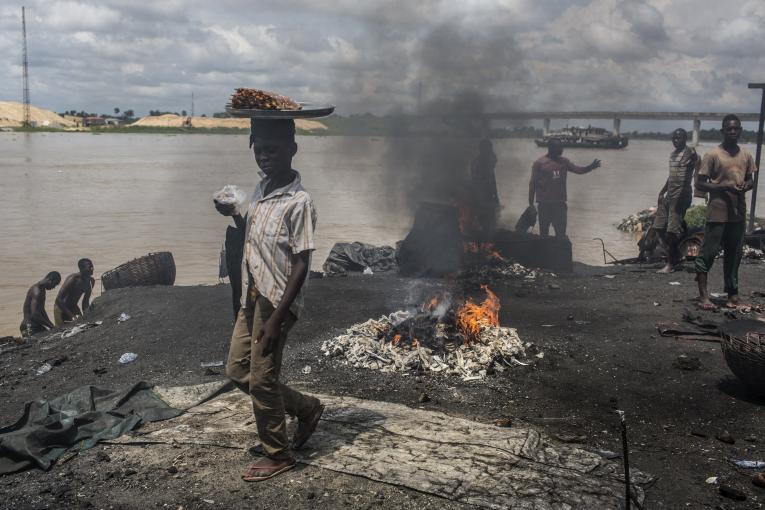
This story is less directly related to plastic waste itself, but reveals how incineration and factories that emit chemicals lead to a higher risk of death.
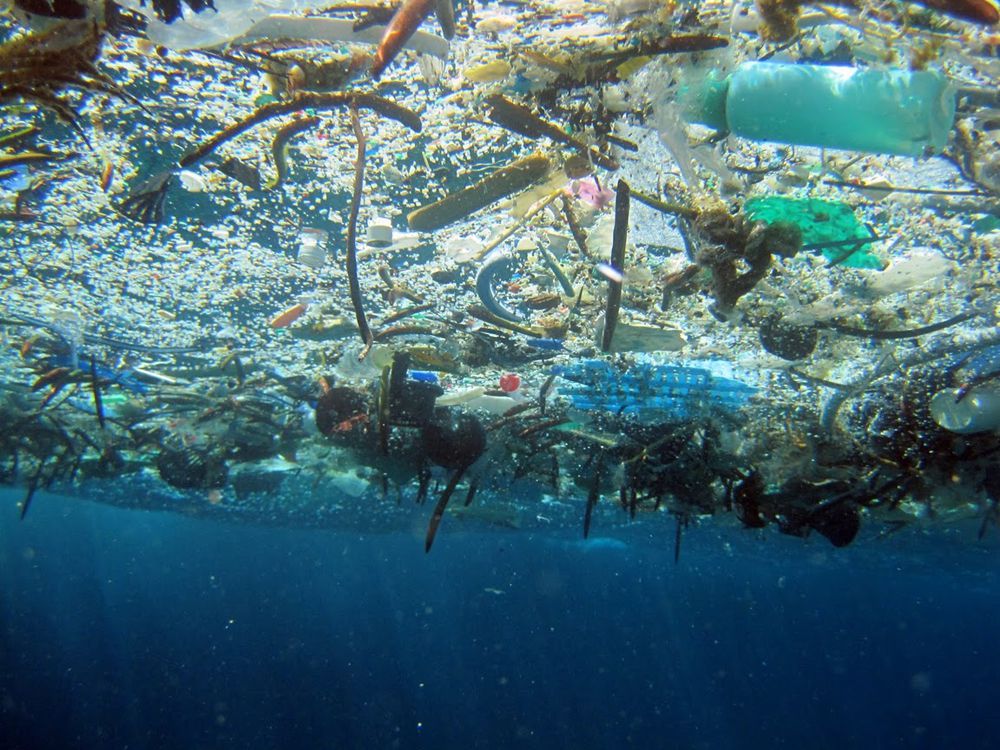
Perhaps the most famous example of plastic waste and the accumulation of waste materials, this is an encyclopedia entry on the Great Pacific Garbage Patch, how it is formed, and the challenges humans currently face in trying to clean it up.
This particular map takes a look at the world in 2010. In this case, the management and mismanagement of plastic waste is defined by the following factors:
The
However, if one were to look at the next visualization
This can be attributed to a few possibilities -- one such factor could be that the United States’s medical system is advanced and robust enough to prevent cardiovascular deaths. However, perhaps what is even more important is that
Finally, there is the
Overall, the impact map
It is clear that mismanaged waste from inadequate plastic recycling infrastructures can cause a variety of downstream effects. This includes increased rates of deaths due to cardiovascular disease such as in Russia, and negatively-impacted potable water access such as in Afghanistan and India.
These are the 11 largest landfills in the world; they are spread across the globe although they cluster in Asia. This finding is fitting with the understanding of how global plastic waste networks flow usually from West to East.
Hover over a point to learn more about the size of each landfill, how much waste they receive daily, and other information about their operation.
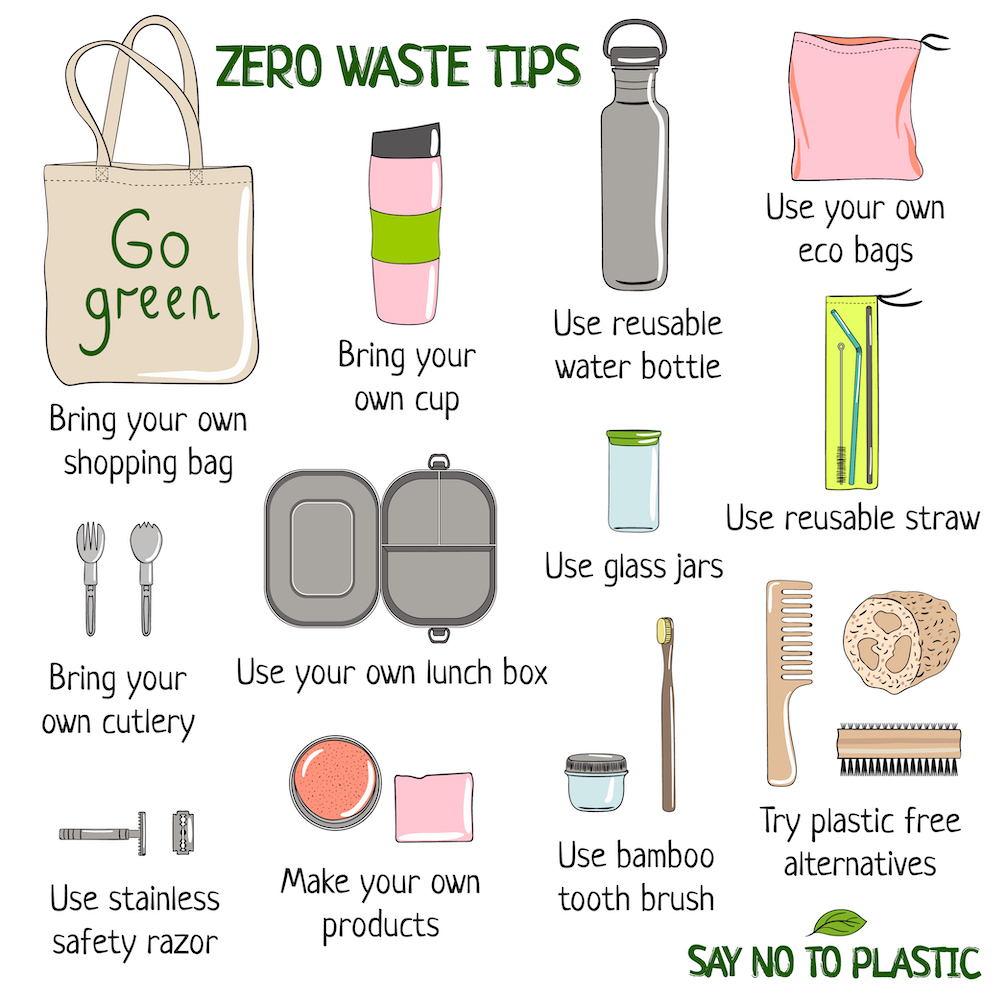
1. Carry reusable products (e.g. bottle, utensils, and bag)
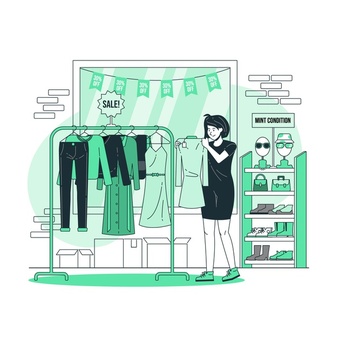
2. Buy clothes at second-hand stores
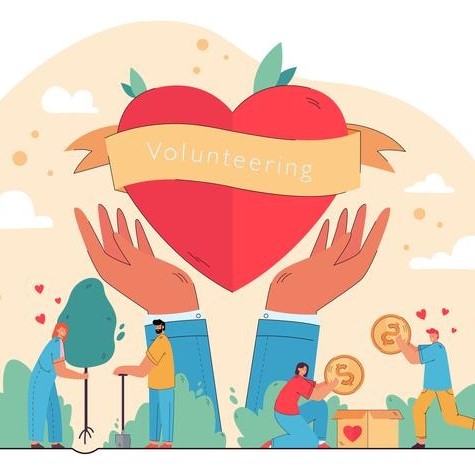
3. Support organizations (e.g. donation and volunteer)
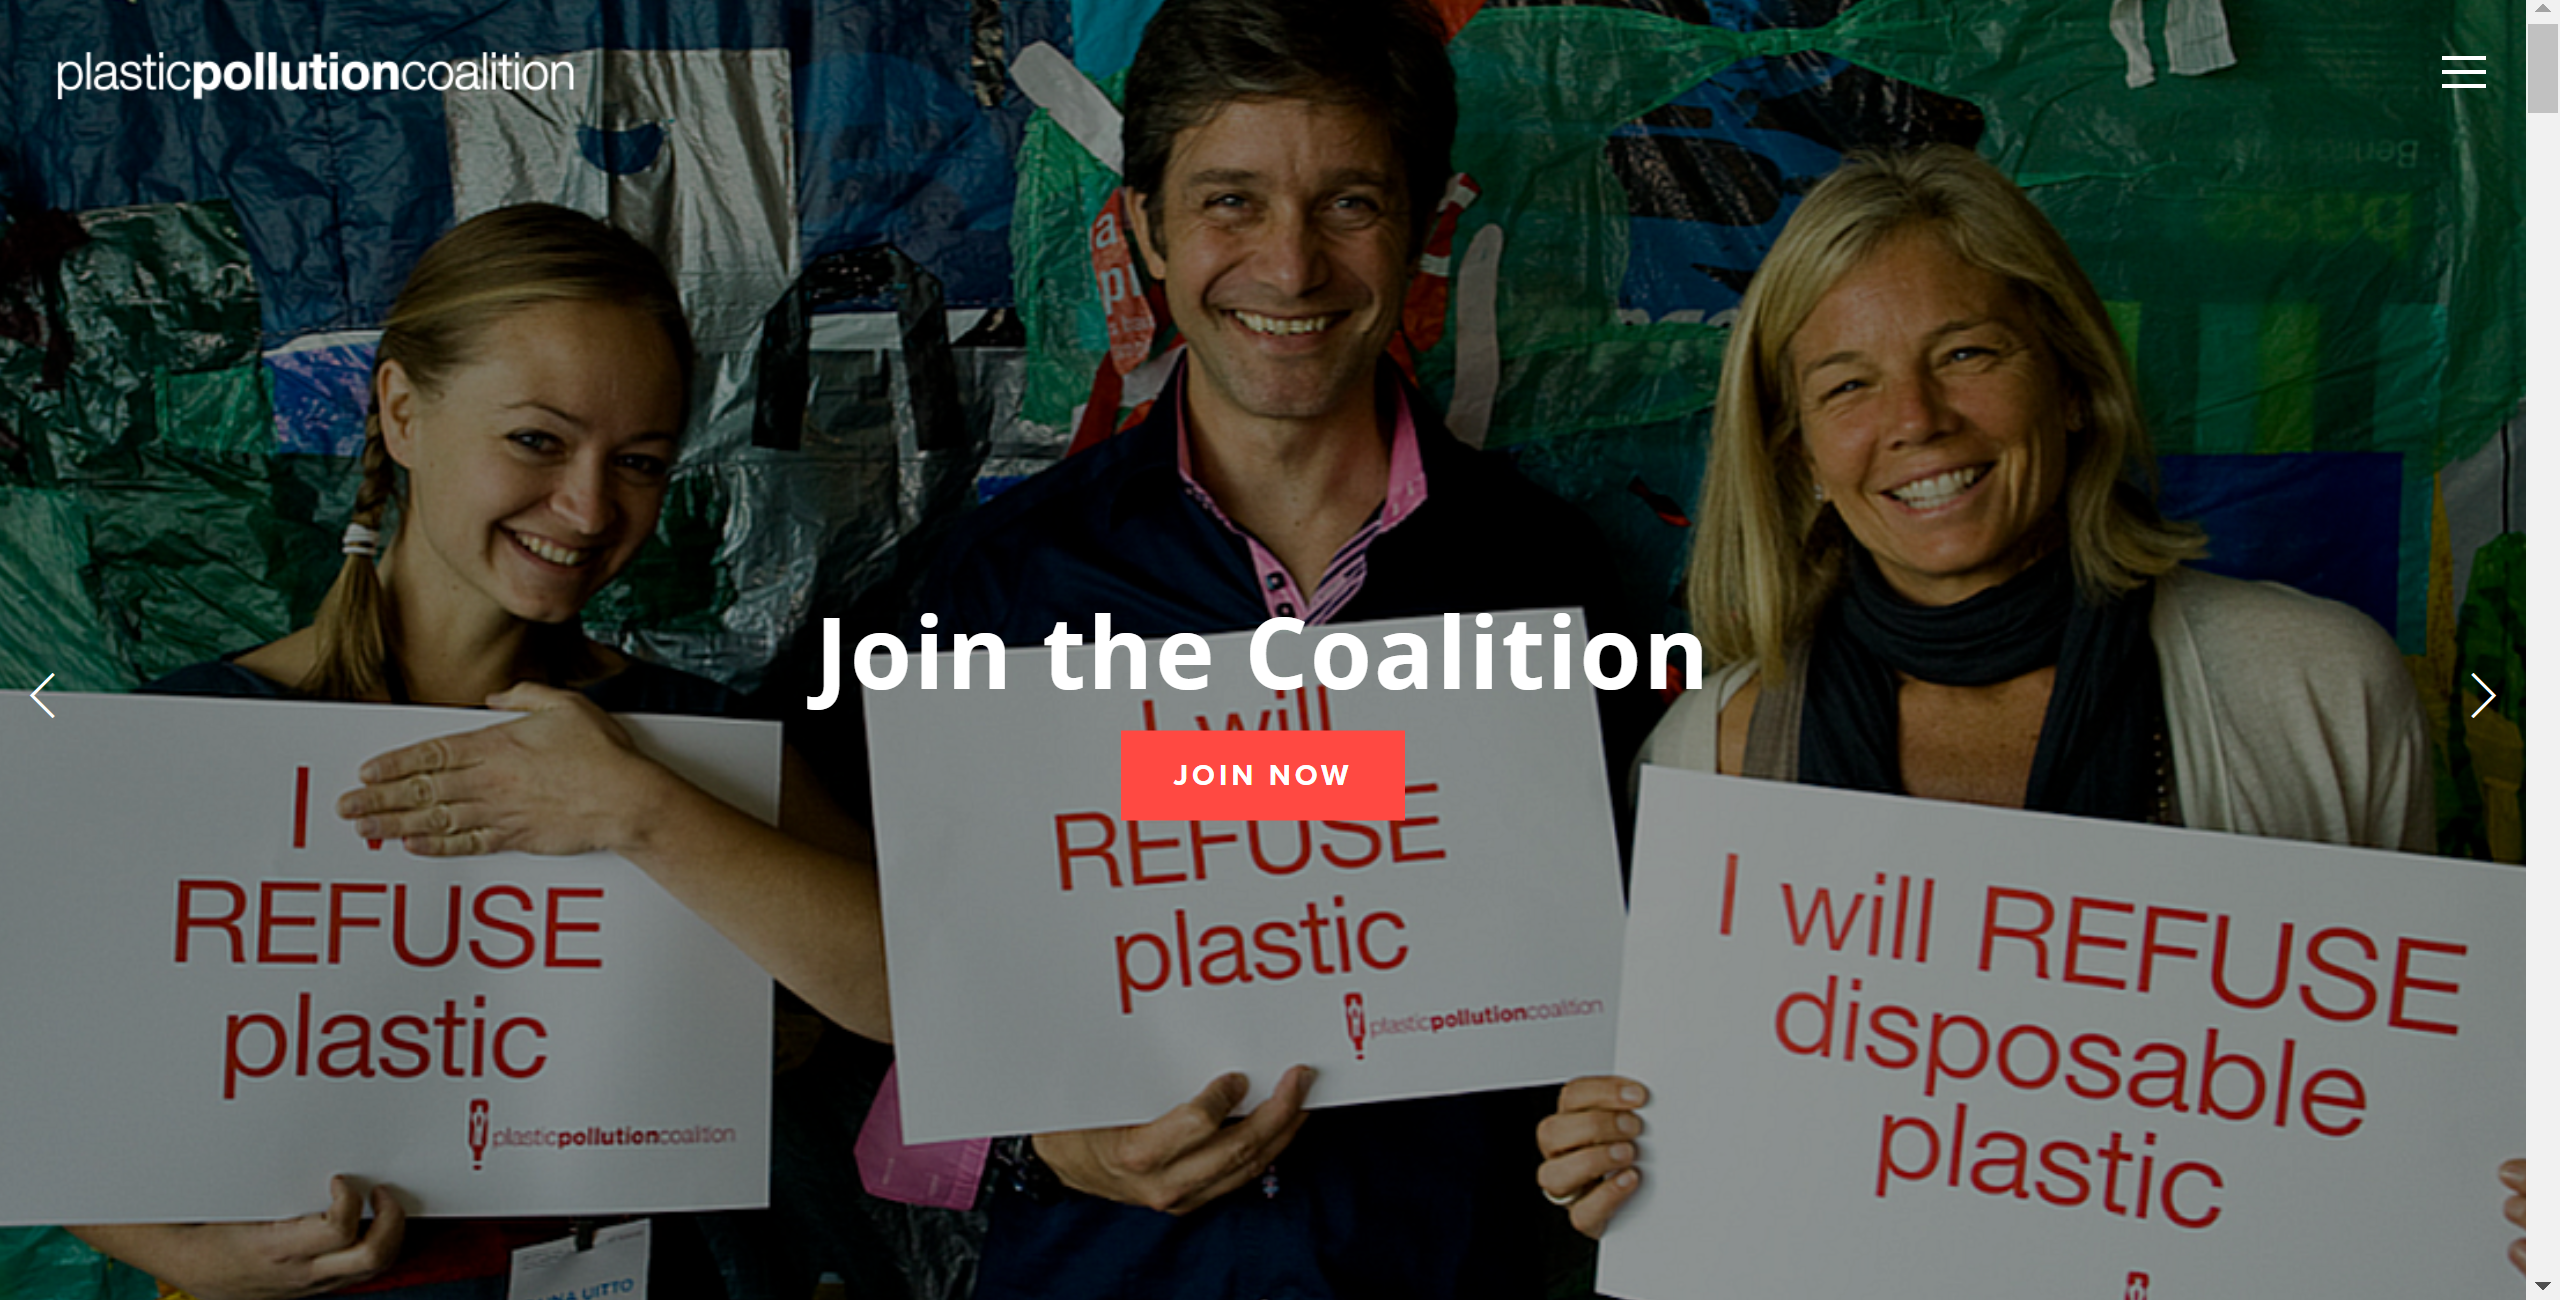
Plastic Pollution Coalition
5Gyres
Algalita
Plastic Soup Foundation
Surfrider Foundation
Plastic Bag Laws.ORG
WaterAid
World Water Council
charity : water

Alice (she/her) is a fourth year Human Biology & Society and Sociology double major. She is interested in public health and environmental justice and is looking forward to working with both academic research and web-mapping.

Emily (she/her) is a fourth year English/History double major and Digital Humanities minor. She is interested in the history and language behind public health and using digital tools to present information effectively.

Hozumi (she/her) is a fourth-year Sociology major and Global Health/Digital Humanities double minor. She is interested in using digital mapping to address global public health issues.
Alabi, O. A., Ologbonjaye, K. I., Awosolu, O., & Alalade, O. E. (2019). Public and Environmental Health Effects of Plastic Wastes Disposal: A Review. https://clinmedjournals.org/articles/ijtra/international-journal-of-toxicology-and-risk-assessment-ijtra-5-021.php?jid=ijtra.
Javorsky, N. (n.d.). How American Recycling Is Changing After China’s National Sword. Bloomberg.com. https://www.bloomberg.com/news/articles/2019-04-01/how-china-s-policy-shift-is-changing-u-s-recycling.
Jin, E. (2019, November 15). A rubbish story: China's mega-dump full 25 years ahead of schedule. BBC News. https://www.bbc.com/news/world-asia-50429119.
Johnson, C. (2021, February 18). Whales and the plastics problem. WWF. https://www.worldwildlife.org/stories/whales-and-the-plastics-problem.
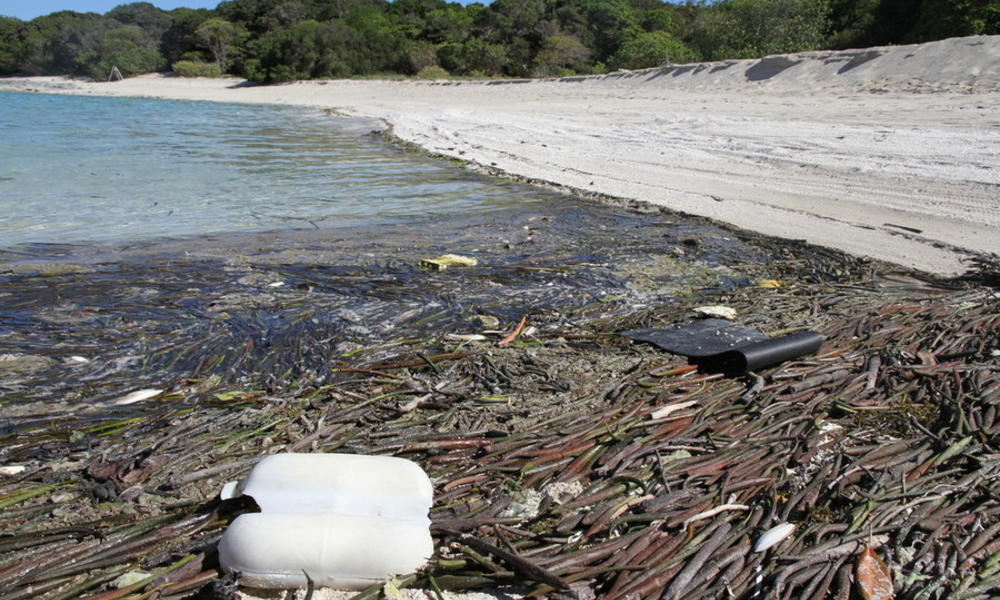
Joseph, V. (2019, May 16). An uninhabited Australian island littered with plastic. WWF. https://www.worldwildlife.org/stories/an-uninhabited-australian-island-littered-with-plastic.
Largest Landfills, Waste Sites, And Trash Dumps In The World. Waste Advantage Magazine. (2016, July 20). https://wasteadvantagemag.com/largest-landfills-waste-sites-and-trash-dumps-in-the-world/".
National Geographic Society. (2012, October 9). Great Pacific Garbage Patch. National Geographic Society. https://www.nationalgeographic.org/encyclopedia/great-pacific-garbage-patch/.
World Wildlife Fund. (2016, March 22). Capturing freshwater stories through the lens of a camera. WWF. https://www.worldwildlife.org/stories/capturing-freshwater-stories-through-the-lens-of-a-camera.
Yiu, K. H. (2020, November 4). Air Pollution Is Starting to Choke Africa. Earth.Org - Past | Present | Future. https://earth.org/air-pollution-is-starting-to-choke-africa/.